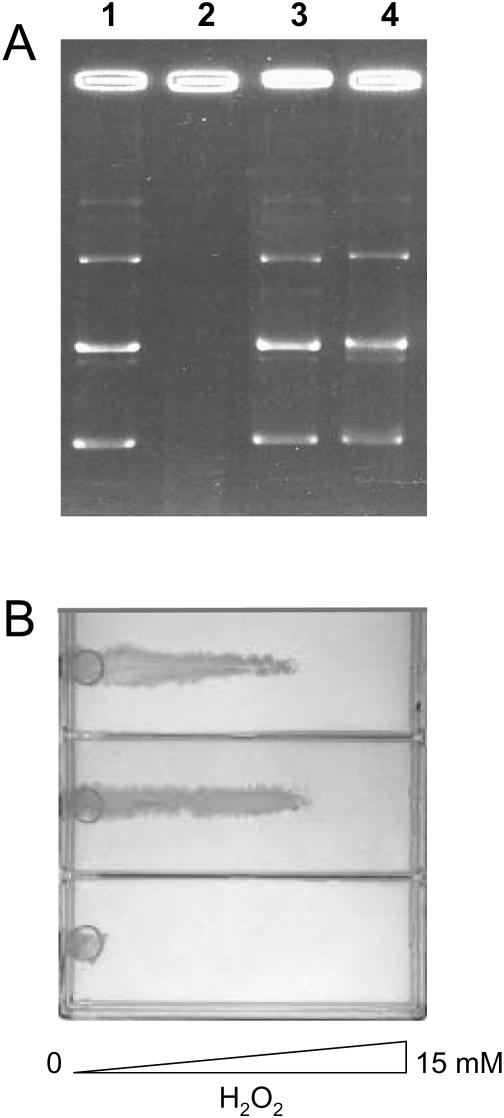
Figure 6.
DNA protection assay in vitro (A) and E.coli resistance to H2O2 challenge (B). In panel (A), lane 1 refers to plasmid DNA, lane 2 to plasmid DNA exposed first to 50 μM FeSO4 and then to 10 mM H2O2, lane 3 to plasmid DNA plus 3 μM E.coli Dps exposed first to 50 μM FeSO4 and then to 10 mM H2O2, lane 4 to plasmid DNA plus 3 μM DpsΔ18 exposed first to 50 μM FeSO4 and then to 10 mM H2O2. Panel (B) shows the survival of E.coli BL21DE3 harboring the dpsΔ18 gene (top) in comparison with that of E.coli BL21DE3 harboring the dps wt gene (middle) and that of E.coli strain ZK126 dps::kan, knock-out for the dps gene (bottom), grown on minimal M63 (0.2% glucose) plates containing a linear concentration gradient of H2O2.

