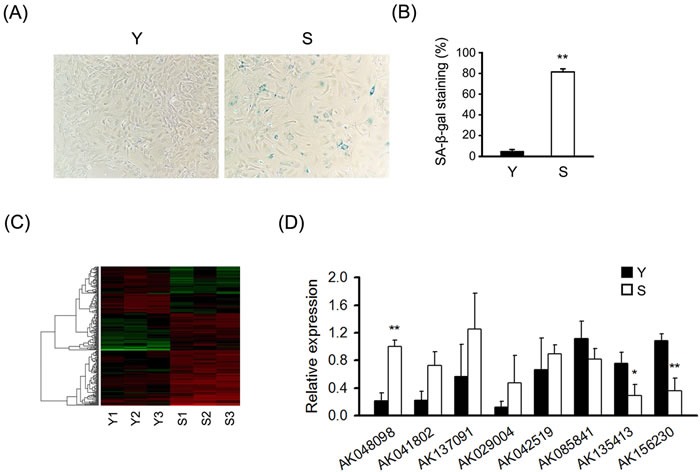
Figure 1. Differential expression of lncRNAs in senescent and young MEFs.

A. Micrographs to visualize senescence-associated β-galactosidase activity in senescent (S) and young (Y) MEFs. “Senescent” indicated the cells at the ninth passages; “Young” indicated the cells at the second passages. B. Percentage of the indicated cells positive for SA-β-gal activity was shown. Cells were quantitated by randomly choosing at least four independent fields. C. LncRNA expression profile of MEFs was analyzed by lncRNA microarray, heatmaps were generated from the hierarchical cluster analysis to show a distinguishable lncRNA expression profile among samples (n = 3). The color “Red” indicates high relative expression, and “green” indicates low relative expression. D. RT-qPCR analysis validation of eight differentially expressed lncRNAs in MEFs under replicative senescence (n = 4). β-actin was used as a loading control. All experiments represent the mean ± SEM from at least there independent experiments. Student's t-test, *P < 0.05, **P < 0.01.
