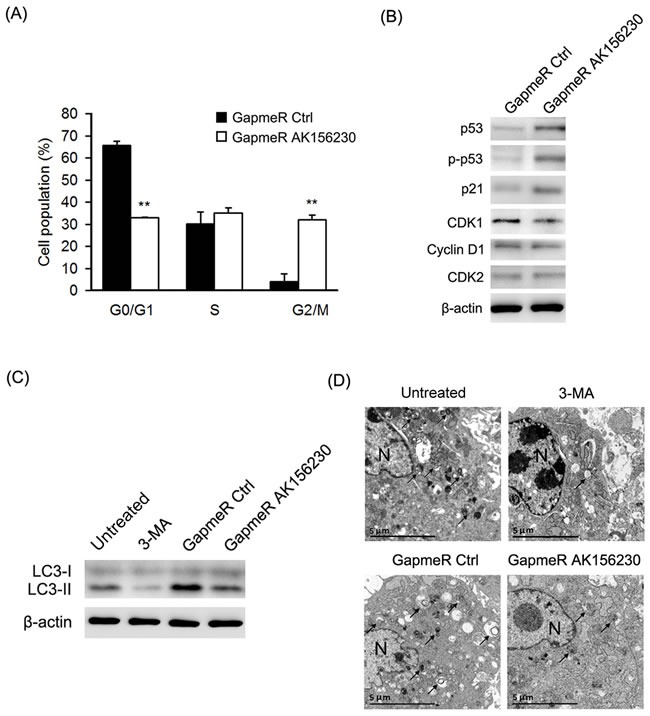
Figure 3. Effects of AK156230 on cell cycle progression and autophagy in MEFs.

A. Cell cycle analysis was performed at 48h after transfection in passage 2 cells transfected with the indicated GapmeRs. The percentage of G0/G1, S, and G2/M are demonstrated as shown. B. Western blot analysis of p53, phosphorylated p53, p21, CDK1, CDK2, and Cyclin D1 from MEFs transfected with the indicated GapmeRs for 72h. C. MEFs at passage 2 were transfected with the indicated GapmeRs for 48h, or treated with 3-MA (10mM) for 4h. Western blotting were performed to detect the levels of non-lipidated LC3 (LC3-I) and its lipidated variant (LC3-II). D. Transmission electron microscopy images of MEFs at passage 2 transfected with the indicated GapmeRs for 48h, or treated with 3-MA (10mM) for 4h. Black arrowheads indicate representative autophagosomes or autophagolysosomes, and the nucleus is denoted by N. These sections were examined at 120kV with a JEOL JEM-1400 transmission electron microscope. β-Actin was used as the loading control. All experiments are represented as mean ± SEM from at least there independent experiments. Student's t-test, **P < 0.01.
