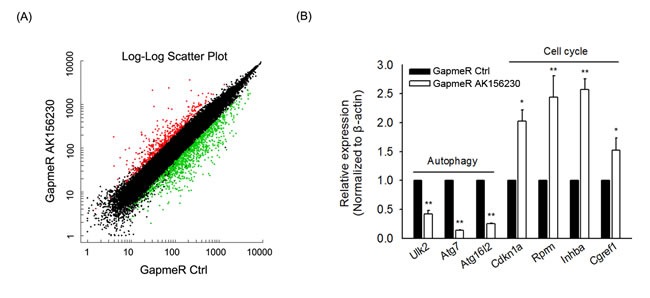
Figure 5. Gene expression signature induced by AK156230 silencing.

A. Scatter plot of differentially expressed genes from MEFs transfection with GapmeR control or GapmeR AK156230. B. The expression of autophagy and cell cycle-related genes in MEFs at 48h after transfection with GapmeR control or GapmeR AK156230 was measured by RT-qPCR analysis. All experiments are represented as mean ± SEM from at least there independent experiments. Student's t-test, **P < 0.01.
