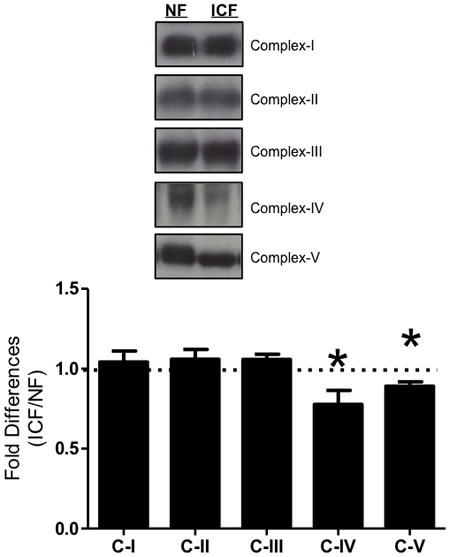
Figure 3. ETC complexes.

Expression levels from subunit proteins of ETC complexes I-V were measured via western blot. These included CI - subunit NDUFB8 (nuclear encoded), CII - 30kDa (nuclear), CIII - core protein 2 (nuclear); CIV - subunit I (mtDNA encoded); CV - alpha subunit (nuclear). Summary of repeated experiments is shown below. Values are represented as means ± SEM; n = 18-28 per group. Significance set at *P < 0.05. Data are expressed as fold difference (ICF/NF).
