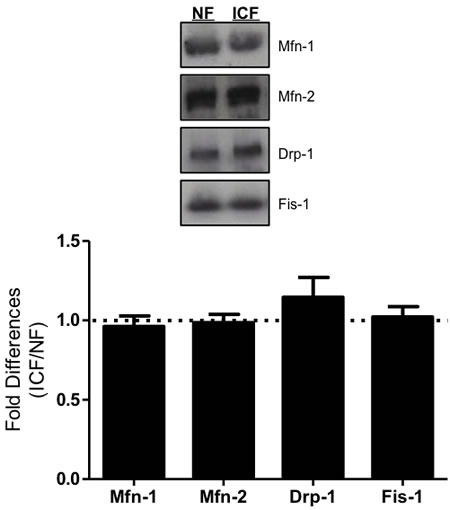
Figure 4. Mitochondrial morphology.

Mitochondrial fusion (Mfn-1 = mitofusin 1; Mfn-2 = mitofusin 2) and fission proteins (Drp-1 = dynamin-related protein 1; Fis-1 = fission protein 1) were measured via western blot. Graphical summary of repeated experiments is shown below. Values are represented as means ± SEM; n = 15-27 per group. Significance set at *P < 0.05. Data are expressed as fold difference (ICF/NF).
