
Figure 1. Hierarchical clustering of mRNAs A. and miRNAs B. in testicular tissue samples.
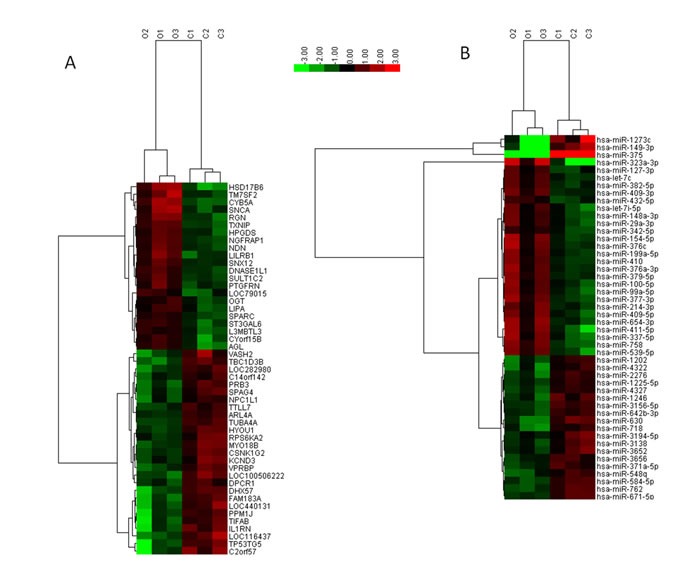
Testicular tissue samples were clustered according to the expression profiles of 49 differentially expressed mRNAs with a two-fold change in expression (A) and 33 differentially expressed miRNAs with a two-fold change in expression (B) between SO patients (n = 3) and OA (n = 3) patients. All samples were properly assigned to the correct class. The key color bar indicates that the mRNA and miRNA expression levels increased from green to red compared to the OA samples. A dark color indicates that the expression levels in the two groups were similar. C: Obstructive-azoospermia controls; O: Severe oligozoospermia.