
Figure 3. In silico analysis of gelsolin and Cu/ZnSOD interaction.
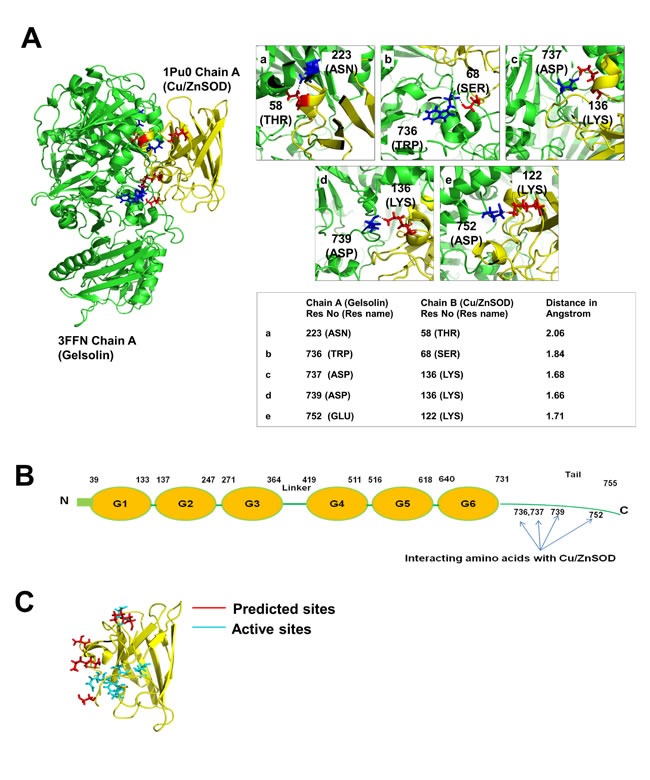
(A) 3-dimensional structure of gelsolin-Cu/ZnSOD complex was obtained using PatchDock analysis. The green structure corresponds to gelsolin (PDB: 3FFN, chain A) and the yellow structure represents the Cu/ZnSOD structure (PDB: 1PU0 Chain A). The interacting region of the complex structure of Gelsolin-Cu/ZnSOD was analyzed using PyMol software. The interacting residues were identified and the distance between these residues were calculated and represented in angstrom. (B) Cartoon model of gelsolin structure with domains and the C-terminal tail region. The C-terminal tail region of gelsolin is important for its interaction with Cu/ZnSOD. Four of the amino acids at positions 736, 737, 739 and 752 of the C-terminal tail region of gelsolin participate in the complex formation with Cu/ZnSOD. (C) The predicted amino acid residues (positions 58, 68, 136 and 122) of Cu/ZnSOD that participate in its interaction with gelsolin lie close to the active sites of the Cu/ZnSOD (47,49,64,81,84,121) in the 3-Dimesional structure.