
Figure 2. Sequence coverage of comparisons of mutation calls in prostate cancer across sequencing centers.
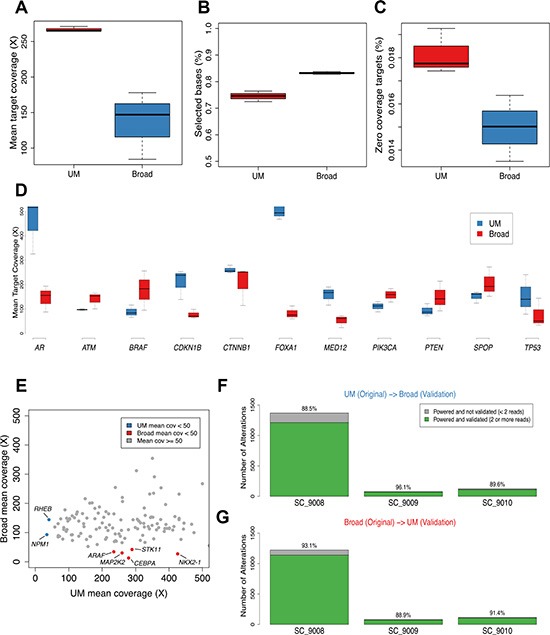
The range of mean target coverage (A), selected bases (%) (B), and zero coverage targets (%) (C) for tumors sequenced at the two sequencing centers are shown. Mean target coverage for biologically relevant prostate cancer genes are from tumors sequenced in the two sites are shown (D). Using a larger panel of 130 clinically relevant genes, mean target coverage for UM and Broad tumors is plotted in (E), with designations for genes that had < 50 X mean target coverage for UM (blue) or Broad (red) platforms. The cross validation rates for UM to Broad and Broad to UM are shown in (F) and (G), respectively when accounting for whether there was adequate power to detect an alteration at both sites which corrects for the difference in sequencing depth achieved between the two centers.