
Figure 3. Comparison of DNA copy number assessments and RNAseq between sequencing centers.
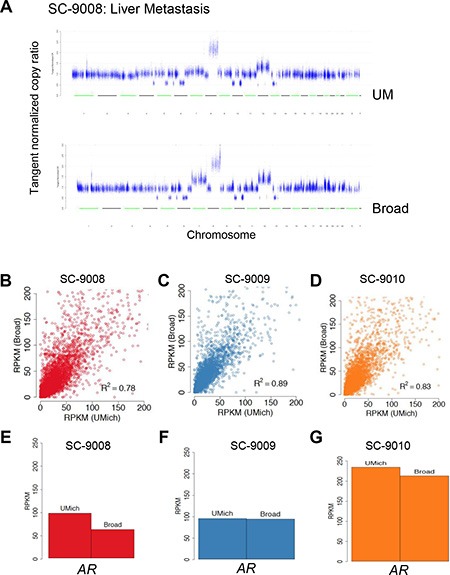
A representative copy number profile obtained from UM and Broad from one case is show in (A). Reads per kilobase per million (RPKM) values from transcriptome data derived at each sequencing center for the three tumors are shown in (B–D) RPKM values for AR from each of the tumors is shown in (E–G).