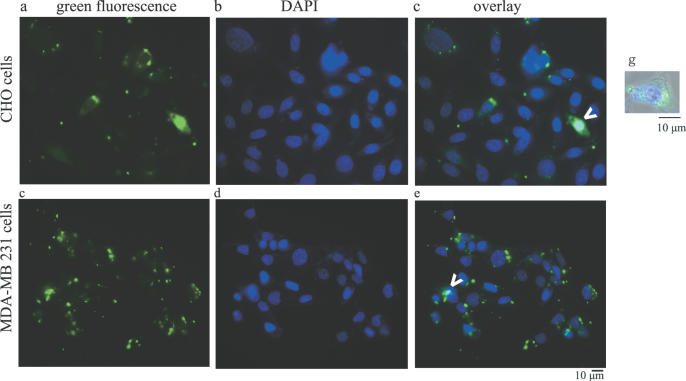
Figure 4.
Subcellular localization of AP-1 decoy ODNs in CHO and in MDA-MB-231 cells. Representative micrographs of cells transfected with fluorescent-labeled AP-1 decoy ODNs (represented as a green signal). Panels (a–c) represent CHO cells; panels (d–f) represent MDA-MB-231 cells. (a and d) Green fluorescence; (b and e) DAPI staining; (c and f) merged images. The arrows indicate rare cells with nuclear decoy ODNs. Panel g represents an image of a representative CHO cell with phase contrast, green fluorescence and blue fluorescence merged that was acquired using the 100× objective. Extranuclear decoy ODN localization is evident.

