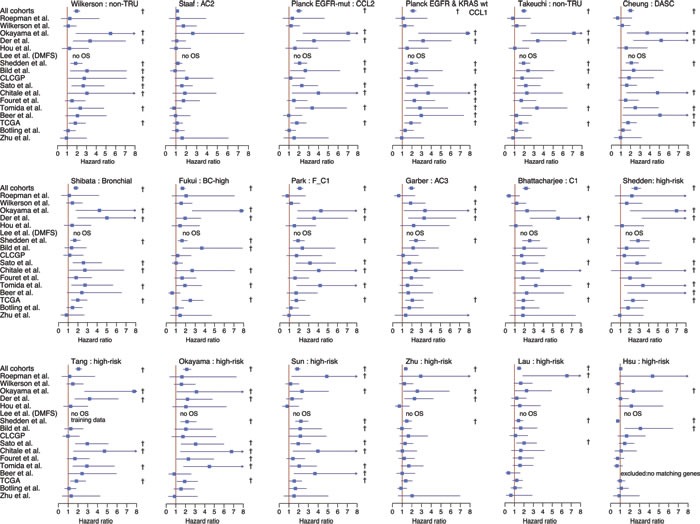
Figure 1. Association of gene expression signature classifications with patient outcome in lung adenocarcinoma.

2395 tumors across 17 cohorts were classified according to 18 different gene expression phenotypes or risk predictors. Association of classifications with patient outcome was investigated using univariate analysis with overall survival as the endpoint and included patients of all stages of disease. Bars for each cohort and subtype represent hazard ratios with 95% confidence intervals. For Wilkerson et al. [5], phenotype analysis was restricted to TRU versus non-TRU classified tumors (merged group of Proximal-proliferative and Proximal-inflammatory). For other multiclass signatures, such as Garber et al. [8], hazard ratios are shown for the subtype with the most prominent poor outcome association. With the exception of the Staaf et al. AC2 subgroup and the Bhattacharjee et al. C1 subgroup, all subtypes displayed represent high-risk groups from the original studies. For all subtypes, the reference group is the original low-risk group (see Table 2). † indicates a significant p-value (p < 0.05) in the univariate analysis. TRU: terminal respiratory unit, DASC: distal airway stem cell.
