
Figure 2. Inactivating mutation of a single BRCA1 allele leads to metabolic reprogramming towards an anabolic phenotype.
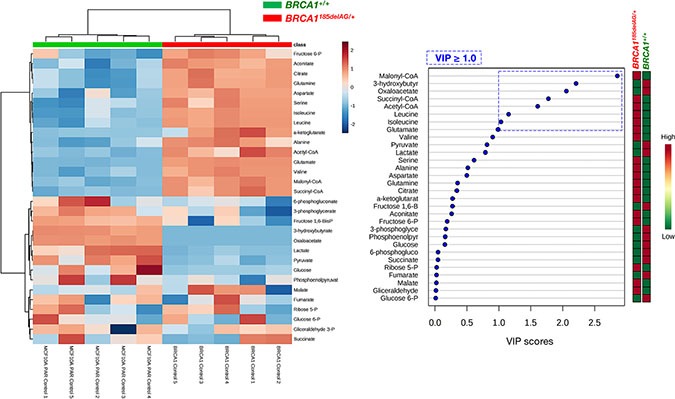
Left. Heatmap visualization and hierarchical clustering analysis with MetaboAnalyst's data annotation tool for the BRCA1185delAG/+ haploinsufficient and BRCA1+/+ wild-type cell groups. Rows: metabolites; columns: samples; color key indicates metabolite expression value (blue: lowest; red: highest). Right. VIP rank-score of quantified metabolites in BRCA1185delAG/+haploinsufficient and BRCA1+/+ wild-type cell groups. Dashed blue box indicates metabolites that achieved VIP scores above 1.0.