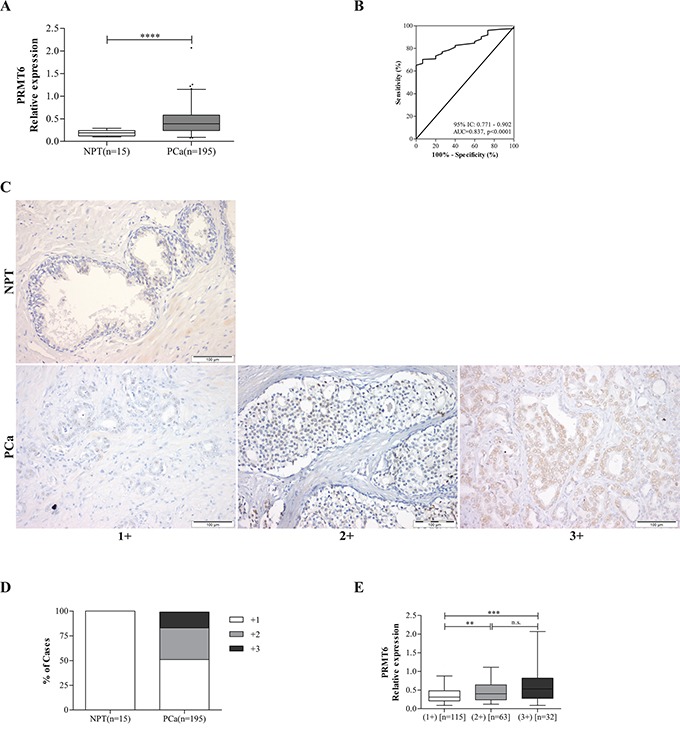
Figure 1. PRMT6 relative expression levels in prostate tissues.

A. PRMT6 is overexpressed in PCa compared to NPTs; B. Performance of PRMT6 mRNA expression as a biomarker for PCa. ROC curve evaluating the ability of PRMT6 expression levels in discriminating PCa from normal prostate tissues; C. Illustrative images of PRMT6 immunostaining in NPT and PCa samples; D. Distribution of PRMT6 immunoexpression and of E. PRMT6 transcript levels in a series of prostate tissue samples (NPT and PCa), grouped according to PRMT6 immunostaining. ****p<0.0001 (Mann-Whitney U-test); (AUC, area under curve; CI, confidence interval).
