
Figure 7. RT-qPCR analysis of EMT markers in several GBM CSCs and of PDGF isoforms profile in pCSC2 shPDGFRα vs pLKO.1.
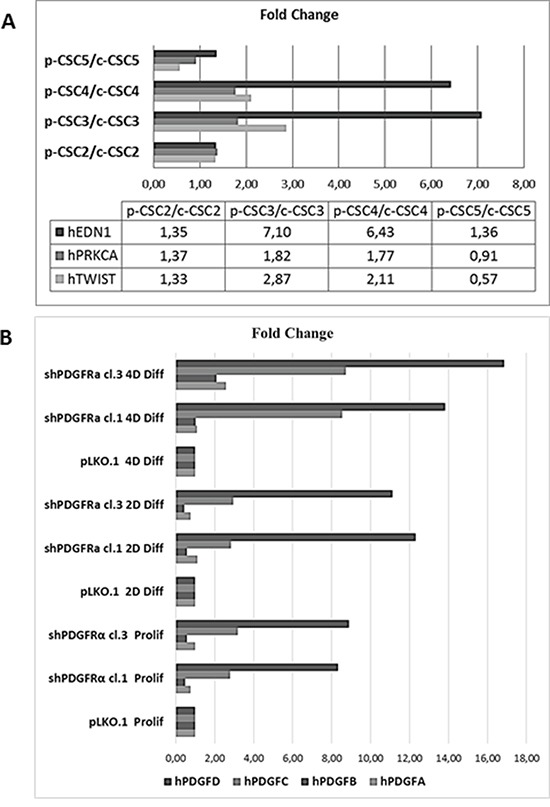
A. We compared several GBM p-CSCs vs the respective GBM c-CSCs for EDN1, PRKCA and TWIST mRNA expression. B. mRNA expression profile of PDGF isoforms highlights the elevated induction of PDGF-C and PDGF-D in p-CSC2 shPDGFRα vs pLKO.1 either in proliferating or differentiated cells. Results represent the mean of two independent experiments performed in triplicate.