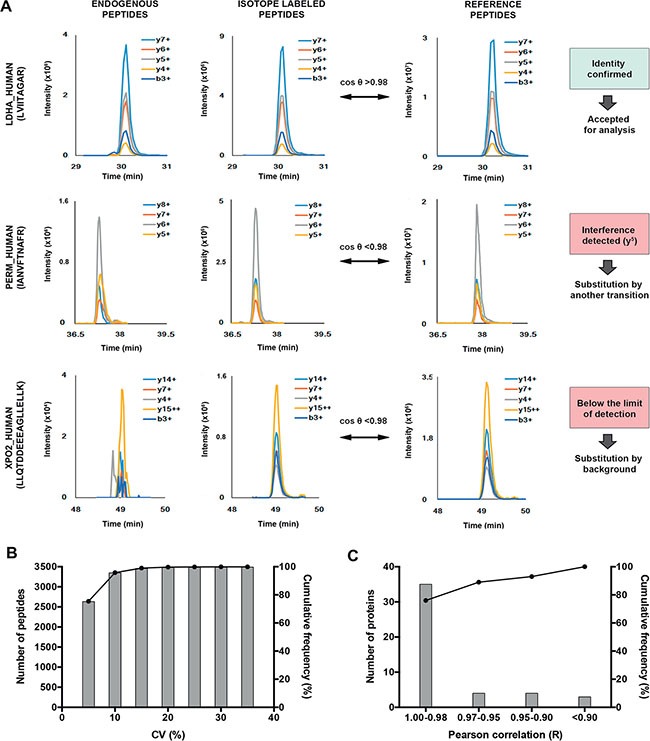
Figure 3. Principle of PRM data quality control.

(A) Peptide identity confirmation by comparison between PRM elution profiles of endogenous and internal standards of each biomarker candidate in the samples and a reference acquisition using the cosine of the spectral contrast angle (θ). A PRM measurement was accepted if the cos (θ) of both endogenous and internal standard are > 0.98. Values below 0.98 due to interferences were solved by the substitution of the interfered XICs. Values below 0.98 due to the limit of detection were substituted by background. (B) Reproducibility of the analytical workflow. The sample preparation was duplicated and the coefficient of variation (CV) was below 15% for 99% of the detected peptides. (C) Pearson correlation between signatures peptides coming from the same protein. The score below 0.90 for three proteins is due to isoform specific peptides.
