
Figure 4. T-UCR have similar pattern of expression in both human and mouse tissues.
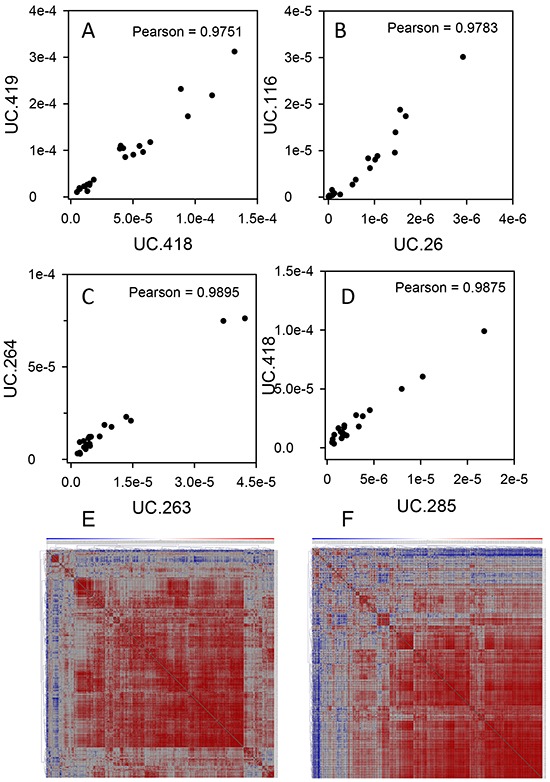
Correlations were determined for T-UCR expression in human A, B. and mouse C, D. tissues that are directly adjacent to one another (A, C) or on different chromosomes (B, D). The Pearson correlations were determined for all T-UCR gene expression in both human and mouse tissues. Of the 481 T-UCRs profiled by qPCR in 24 specimens of PDAC, adjacent benign and normal pancreas tissues, 307 were independently expressed. The pairwise Pearson correlation coefficients for all 307 expressed T-UCRs in these specimens were determined E. Of the 481 T-UCRs profiled by qPCR in pancreas of young and old P48Cre/wt; KrasLSL-G12D/wt, Pdx-1-Cre; KrasLSL-G12D/wt and control mice, 328 were independently expressed. The pairwise Pearson correlation coefficients for all 328 expressed T-UCRs in these specimens were determined F. Data are presented as heatmaps with red having the highest correlation and blue the lowest.