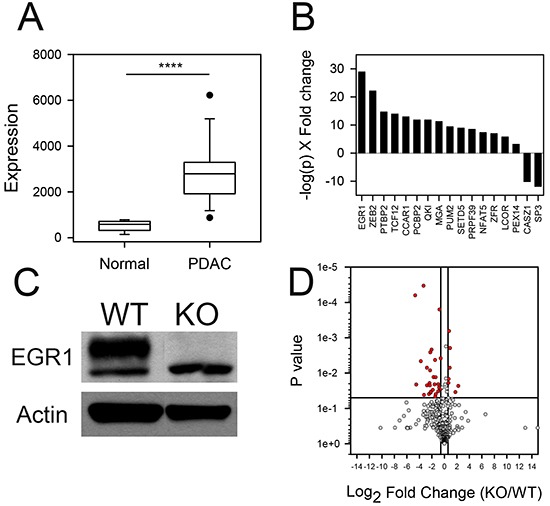
Figure 5. T-UCR expression in EGR1 knockout PANC-1 cells.

A. EGR1 expression in normal pancreas and PDAC from data set GSE71989. B. Differential expression of transcription factors in patient specimens of normal pancreas and PDAC (GSE71989 data set) ranked as -log(p)×FC. C. The CRISPR/Cas9 system was used to knockout the EGR1 gene in PANC-1 pancreatic cancer cells. The immunoblot of EGR1 and beta actin are shown in EGR1 knockout (KO) and wildtype (WT) PANC-1 cells. D. Expression values of T-UCRs in the EGR1 KO compared to WT cells were converted to Log2 (fold change) and the Log2 (fold change) are compared to p-values using a Volcano plot. Dots represent the mean of triplicate biological replicates for a given T-UCR. A threshold of P < 0.05 and fold change greater than 1.5-fold (red symbols) was applied to determine statistical significance, **** P < 0.0001.
