
Figure 1.
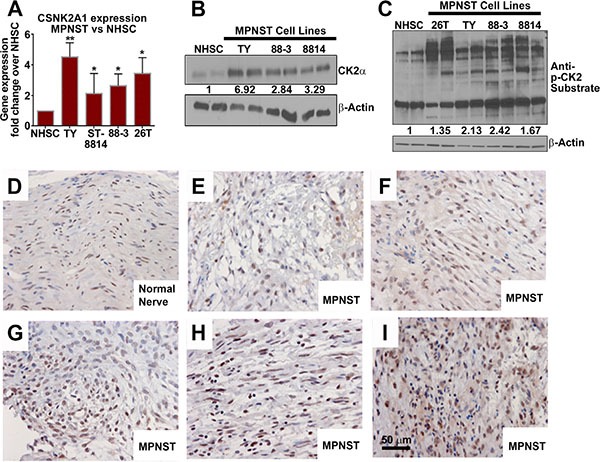
(A) Three designated MPNST cell lines show over-expression of CSNK2A1 mRNA vs NHSCs. (B) Western blot analysis shows that CK2α protein is overexpressed in MPNST cell lines vs NHSCs. (C) Western blot analysis using an antibody that detects CK2 substrate phosphorylation reveals increased CK2 activity in MPNST cell lines. Some CK2 targets are phosphorylated in MPNSTs but not in NHSCs. (D–I) Expression of CK2α shown by IHC in human nerve (D) and MPNST patient biopsy samples (E–I). Asterisks in A indicate statistically significant differences (*p < 0.05, ** p < 0.01, ***p < 0.001). QPCR results are shown as the mean ± standard deviation (S.D.) of three independent biological replicates, each in triplicate. Western blots are representative of at least 3 independent experiments.