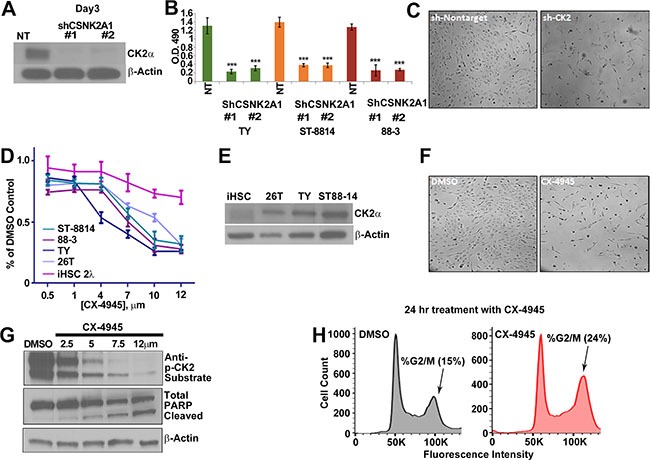
Figure 2.

(A) MPNST (S462-TY) cells were treated with 2 unique shRNAs targeting CSNK2A1 for 72 h, and western blot analysis confirmed a reduction of CK2α protein. NT = cells treated with a non-targeting shRNA control. (B) Three day CK2α shRNA treatment had a cytotoxic effect on MPNST cell lines as measured by MTS; y-axis is O.D. reading at 490 nm. (C) Phase contrast photomicrographs show S-462TY cells 3 days after NT or shCK2α #1. (D) Increasing concentrations of CX-4945 (72 h) decrease MPNST cell line growth. CX-4945 has less effect on control iHSC cells as measured by MTS; y-axis is O.D. reading at 490 nm. (E) CK2α is overexpressed in MPNST cell lines as compared to the iHSC control cell line. (F) Phase contrast shows that CX-4945 treatment depletes cell population at 24 h as compared to the DMSO control. (G) MPNST cell lines show a decrease in CK2 activity in response to escalating CX-4945 concentrations (24 h) as measured by a western blot analysis using anti-CK2 substrate, and to undergo apoptosis as indicated by increased cleaved PARP. H. CX-4945 causes MPNST cells (S462-TY) to increase the percent of cells in the G2/M phase of the cell cycle as indicated by flow analysis of propidium iodide stained cells (S.D. of DMSO = 1.8% and CX4945 = 3.8%). Asterisks in B indicate differences after Student's t-test (*p < 0.05, **p < 0.01, ***p < 0.001). CX-4945 cell viability assay, MTS, and qPCR results are the mean of three independent biological replicates each in triplicate, ± S.D.
