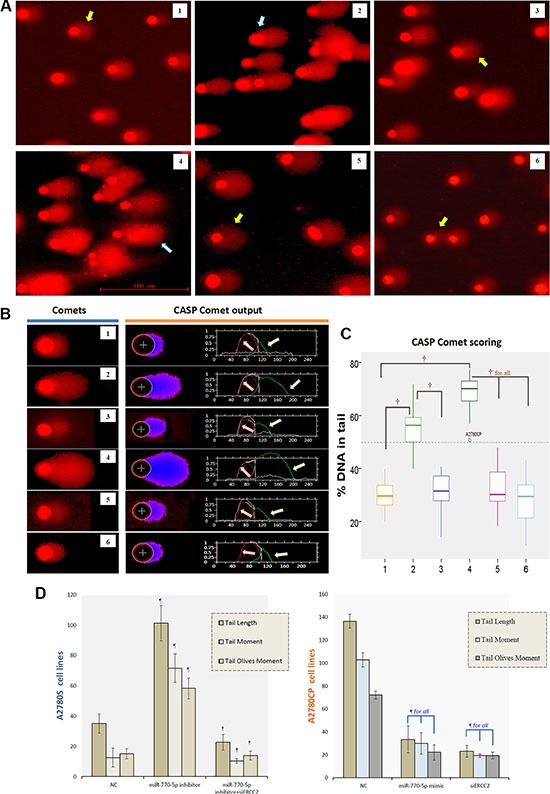
Figure 6. CASP comet analysis of alkaline comet assay images.

(A) Representative image of the modified COMET assay used to evaluate DNA damage after treatment with cisplatin. The blue arrow indicates a comet with a long tail, and yellow arrow a comet with a short tail. The scale bar is 100 μm. (B) Alkaline comet assay images for each group after cisplatin treatment are shown on the left, and CASP comet output and analysis are shown on the right. Red lines (indicated by red arrows) represent the head of comet, and green lines (indicated by green arrows) represent the tail of comet. (C) Amounts of DNA damage with and without cisplatin treatment in each group. †p < 0.001. 1: A2780S NC, 2: A2780S miR-770-5p inhibitor, 3: A2780S miR-770-5p inhibitor + siERCC2, 4: A2780CP NC, 5: A2780CP miR-770-5p mimics, 6: A2780CP siERCC2. (D) Spontaneous and cisplatin-induced means ± S.D. for three additional replicates of the Comet assay after cisplatin treatment. ¶p < 0.001 compared to negative controls of the same cell type; †p < 0.001 compared to the scrambled miR-770-5p or mimics group of the same cell type.
