
Figure 4. Effects of mTOR inhibition and VEGF overexpression on mTOR, AP-1, and VEGF expression.
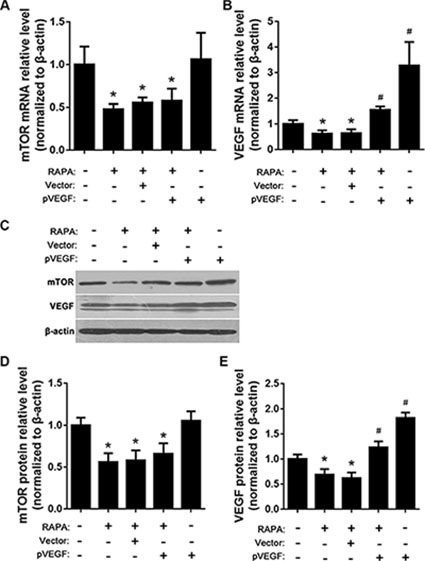
(A) mTOR mRNA levels after RAPA and/or pVEGF treatment were detected by RT-qPCR, *p < 0.05 vs. untreated cells. (B) VEGF mRNA levels after RAPA and/or pVEGF treatment were detected by RT-qPCR, *p < 0.05 VEGF low expression vs. untreated cells, #p < 0.05 VEGF high expression vs. untreated cells. (C) mTOR and VEGF protein levels after RAPA and/or pVEGF treatment were detected by Western blot. (D) Relative mTOR protein levels, *p < 0.05 vs. untreated cells. (E) Relative VEGF protein levels, *p < 0.05 VEGF low expression vs. untreated cells, #p < 0.05 VEGF high expression vs. untreated cells.