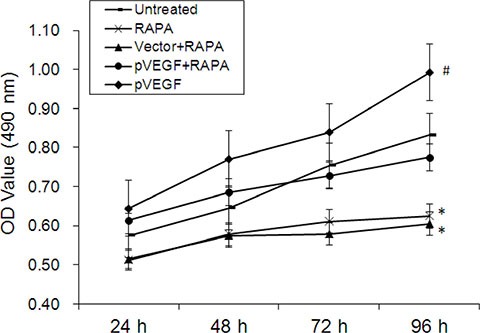
Figure 5. Effects of mTOR inhibition and VEGF overexpression on aortic endothelial cell proliferation.

Cell growth curves for all groups 24, 48, 72, and 96 h after treatment, *p < 0.05 pVEGF vs. untreated cells, #p < 0.05, RAPA or empty vector combined with RAPA (vector+RAPA) vs. untreated cells. Proliferation did not differ between untreated cells and cells treated with pVEGF combined with RAPA (pVEGF+RAPA) (p > 0.05).
