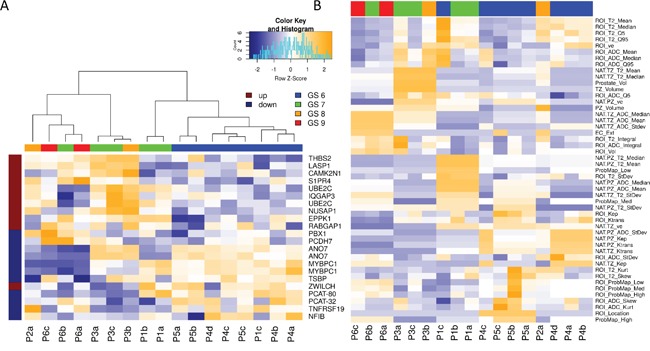
Figure 3. Hierarchical clustering of Genomic and Radiomic features and patient samples.

A. Hierarchical clustering on expression of the Decipher genes and patient samples. Note how biopsies are grouped by Gleason Score. Decipher genes, known to be highly expressed in more aggressive cancers (marked in dark red) are more highly expressed in higher GS samples and vise versa; B. Unsupervised clustering of all radiomic features revealed mostly clustering by patient.
