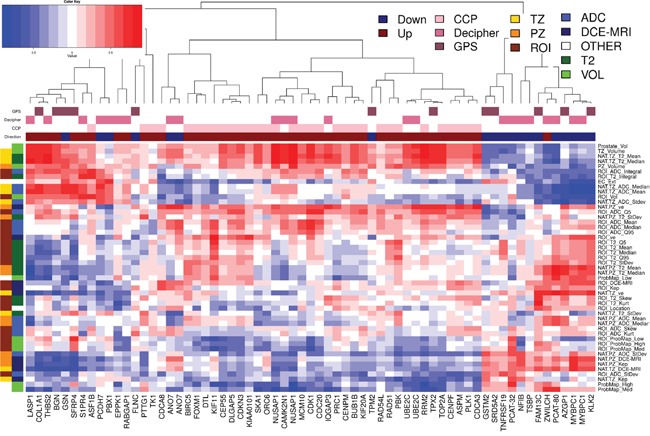
Figure 4. Pearson's correlation analysis of imaging features and 65 genes from commercially available prostate cancer classifiers.

Hierarchical clustering on Pearson's correlation distance between radiomic features and genes from commercially available prostate cancer classifiers: CCP (Cell Cycle Progression), Decipher and GPS (Genomic Prostate Score). Genes in these signatures that are up-expressed in aggressive cancers are indicated by a dark red box over the gene's column while those that are down-expressed are indicated with a blue box. Groups of radiomic features are indicated along the dendrogram on the left. Group1 (left) connects the radiomic feature with location (TZ, PZ and ROI); Group 2 is related to the image modality/function: T2w, ADC and DCE-MRI.
