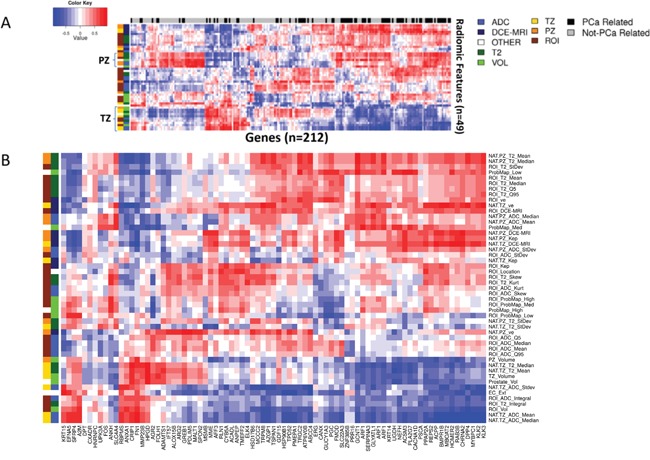
Figure 5. Pearson's correlation analysis identified genomic features that were highly associated with the imaging features.

A. Hierarchical clustering on Pearson's correlation distance between radiomic features and genes with significant expression values. Prostate cancer related genes are indicated in black along top dendrogram. Two clusters with reciprocal behavior are related mostly to PZ and TZ radiomic features; B. Prostate cancer gene enriched region of the heatmap in (A). Groups of radiomic features are indicated along the dendrogram on the left. Group1 (left) connects the radiomic feature with location (TZ, PZ and ROI); Group 2 is related to the image modality: T2w, ADC and DCE-MRI.
