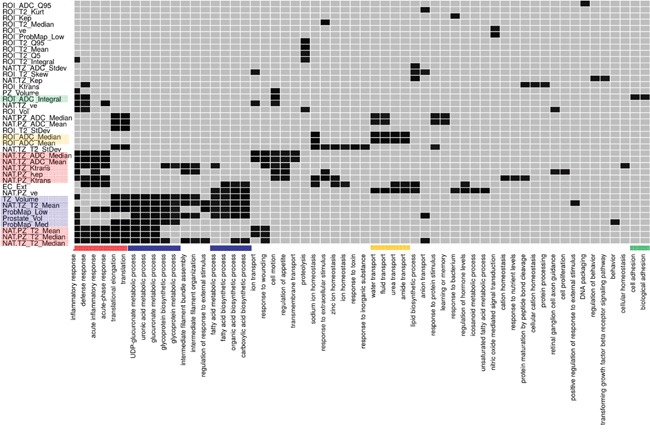
Figure 6. Enrichment analysis using Database for Annotation, Visualization and Integrated Discovery (DAVID) identified enrichment of radiomic features for different Gene Ontology (GO) biological processes.

Enrichment analysis was performed for each radiomic feature using the list of significantly expressed genes with a significant correlation to that radiomic feature. Significantly enriched (p-value < 0.05) biological processes are shown in black. radiomic features with no enriched processes are not shown. The association between radiomic features and biological processes are denoted with the same color. For example, for PZ and TZ radiomic features (highlighted in red), biological processes such as immune/inflammatory and cell-stress responses were significantly enriched GO terms (red bar).
