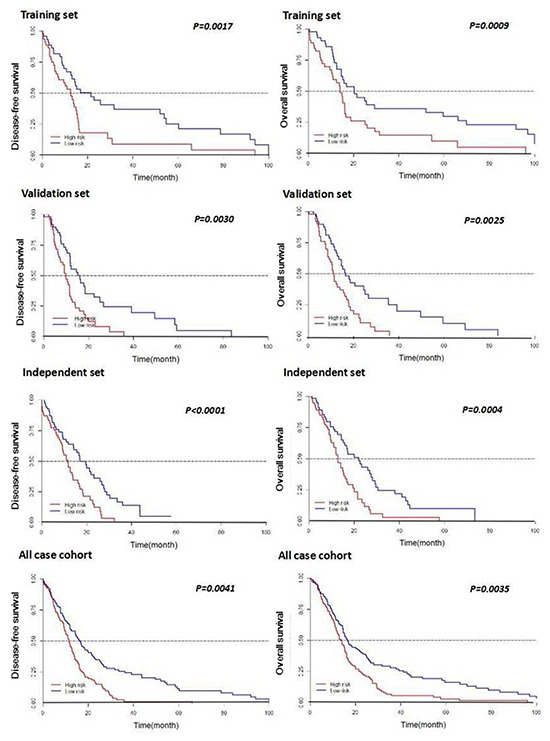
Figure 4. Kaplan-Meier curves of DFS and OS according to expression of the seven-miRNA signature in patients with GBM.

Correlations for patients with low-risk and high-risk miRNA expression scores are shown for the training set, the validation set, the independent set, and all patients combined. P-values were calculated by log rank testing.
