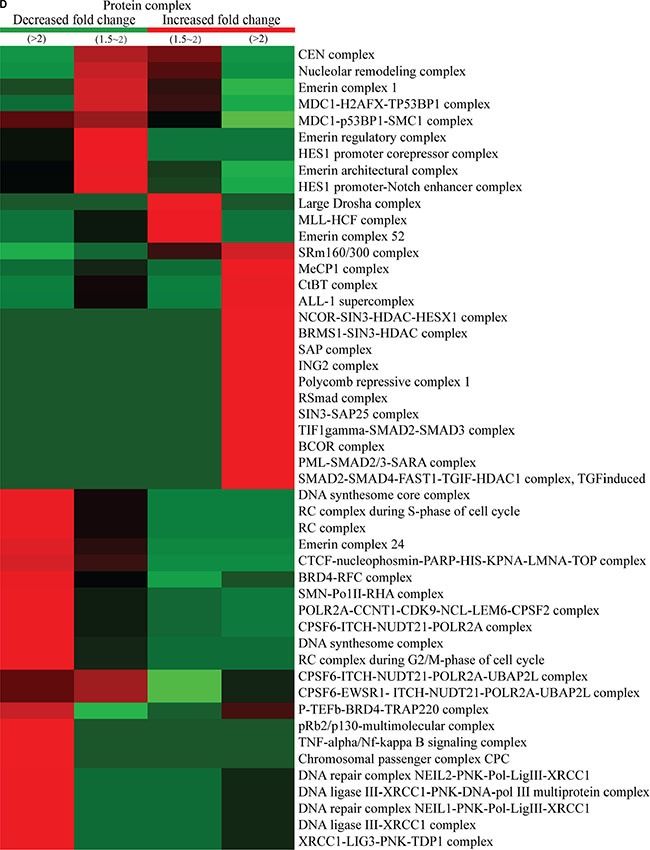
Figure 4. Functional enrichment-based clustering analysis for the quantified phosphorylated proteins.

According to the functional differences observed between increased and decreased proteins, GO-term association and enrichment analysis using the DAVID program (https://david.ncifcrf.gov/) were performed. (A) Biological process analysis. (B) Cellular component analysis. (C) Molecular function analysis. (D) Protein domain analysis.
