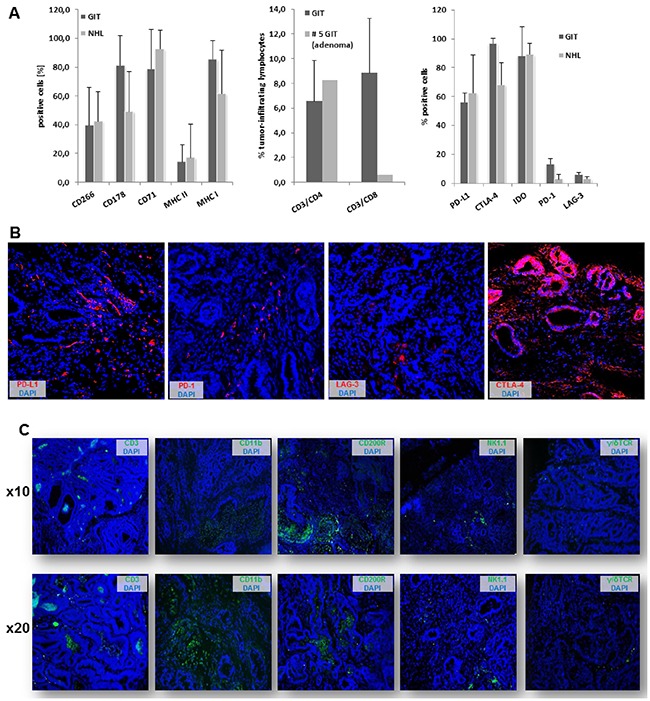
Figure 3. Phenotyping & infiltration pattern.

A. Flow cytometric analysis of GIT and lymphomas showing large phenotypic uniformity between both entities (left chart). Lymphocytic infiltration of primary tumor specimens (middle chart) as well as immune checkpoint expression (right chart) as quantified by flow cytometry (n=5-10 cases/tumor entity). B. Immunofluorescence staining of immune checkpoint molecules within GIT specimen. Original magnification x20. C. Immune cell infiltration pattern of GIT as determined by immunofluorescence. Original magnification x10 and x20, respectively.
