
Figure 5. IK6 activates STAT5 and HO-1 in BCR-ABL1+-IK6 leukemic cells.
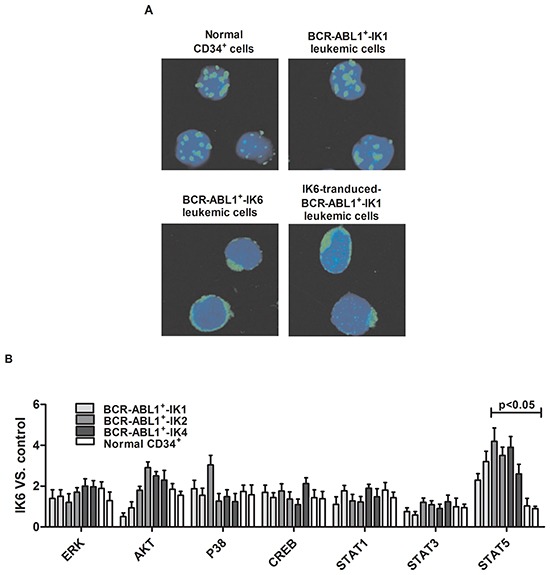
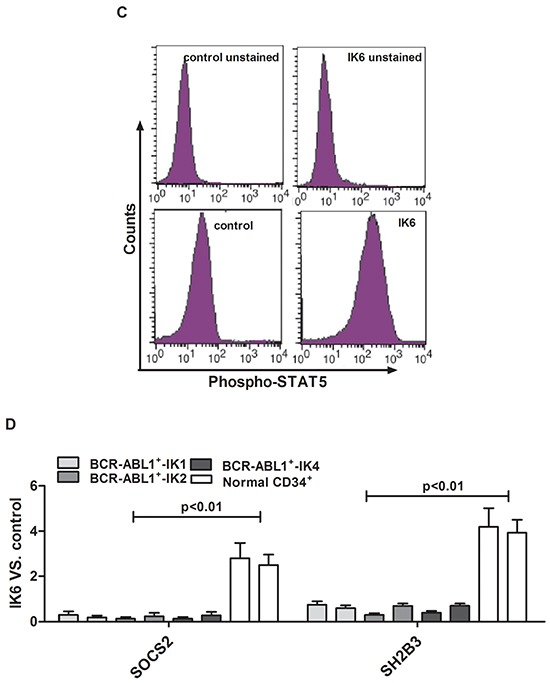
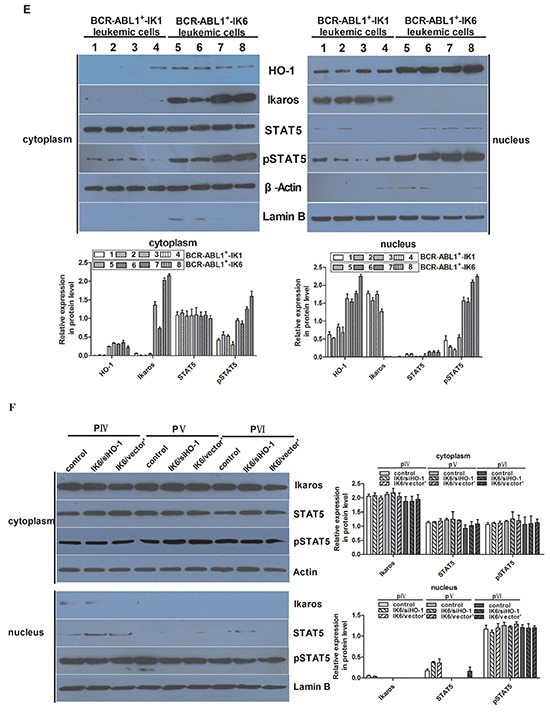
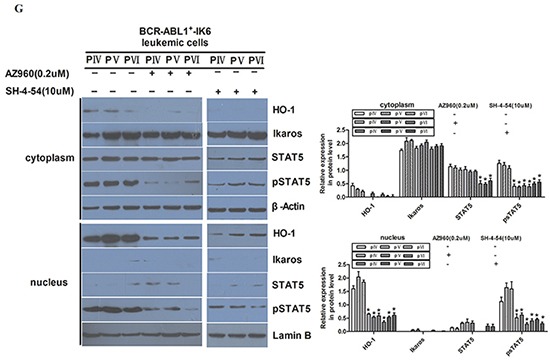
A. Confocal microscopy images of representative single primary CD34+ cells, either normal or BCR-ABL1-IK1, BCR-ABL1-IK6 and IK6-transduced BCR-ABL1+-IK1, and stained with DAPI (blue) and an antibody reactive with Ikaros (green). B. Phosphoprotein analysis of IK6- or control-transduced CD34+ cells shown individually for 2 BCR-ABL1+-IK1, 2 BCR-ABL1+-IK2, 2 BCR-ABL1+-IK4 and 2 normal BM samples. Values shown for each protein are the mean±SD of the ratios of the median fluorescent intensity values obtained for the IK6-compared with control-transduced cells in 3 replicate experiments. P values were generated by comparing the effects of IK6 on leukemic cells vs normal BM cells. C. Representative flow cytometry histograms taken from one of the patient experiments shown in panel B. D. Comparison of transcript differences in IK6- and control-transduced CD34+ cells for 6 IK6-negative and 2 normal BM samples. Values shown are the mean SD of the ratios of normalized transcript levels in IK6- as compared with control-transduced cells. E. Expressions of HO-1, Ikaros, STAT5, pSTAT5 in patients with either IK1 or IK6 detected by Western blot. 1, 2, 3, and 4 are samples of 4 randomly selected BCR-ABL1+-IK1 patients, 5, 6, 7 and 8 represent samples of 4 BCR-ABL1+-IK6 patients. F. Western blot analyzed the expressions of Ikaros, STAT5, pSTAT5 in different cells by silencing HO-1 expression. G. Expressions of HO-1, Ikaros, STAT5 and pSTAT5 were measured after treating with 0.2uM AZ906 or 10uM SH-4-54 for 48 hours.