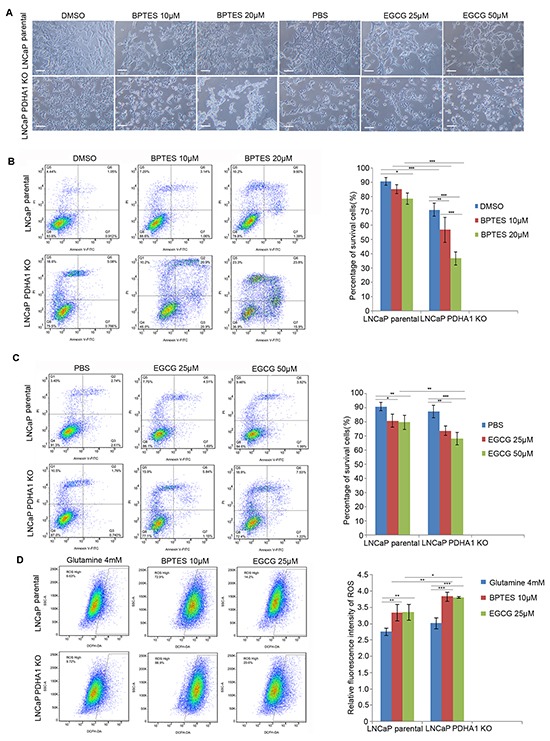
Figure 5. The glutaminase inhibitor BPTES and glutamate dehydrogenase inhibitor EGCG impair cell survival in the PDHA1 KO cells.

A. shows represent morphology of the cells treated with control, BPTES and EGCG of indicated concentrations for 48hrs. The scale bar is 100μm. B. BPTES significantly induces apoptosis in the parental and PDHA1 KO cells. Cell survival and apoptosis were assessed by flow cytometry analysis of Annexin-V binding. C. EGCG induces greater apoptosis in the PDHA1 KO cells. Cell survival and apoptosis was assessed by flow cytometry analysis of Annexin-V binding. D. BPTES and EGCG increase the ROS in the PDHA1 KO cells. Left panel represents images of DCFH flow cytometry of each group. The right panel is for the relative mean DCFH fluorescence intensities. The data are expressed as the mean ± S.D. of 3 independent experiments. *P < 0.05, **P < 0.01, ***P<0.001, according to 2-tailed Student's t test.
