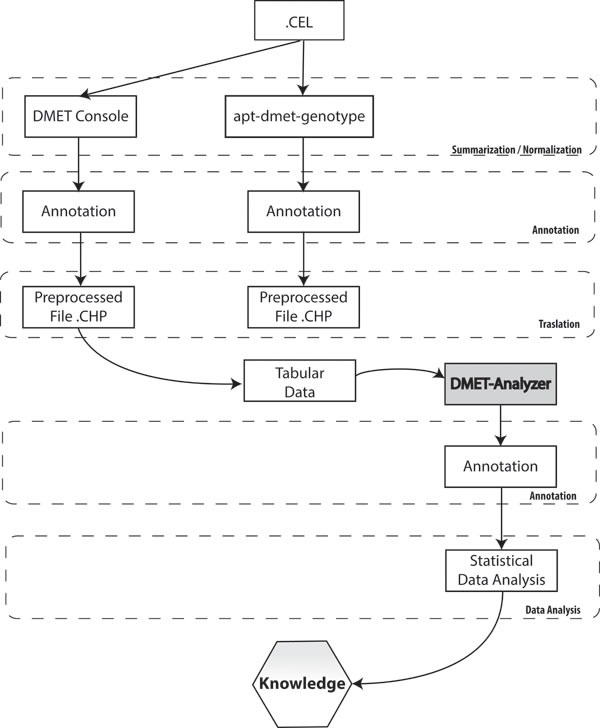
Figure 4. Statistical analysis and interpretation.

The picture describes necessary steps to convert intensity value in actionable knowledge. Each column represents the flow of information when using respectively DMET® Console, apt-DMET-genotype and DMET-Analyzer.
