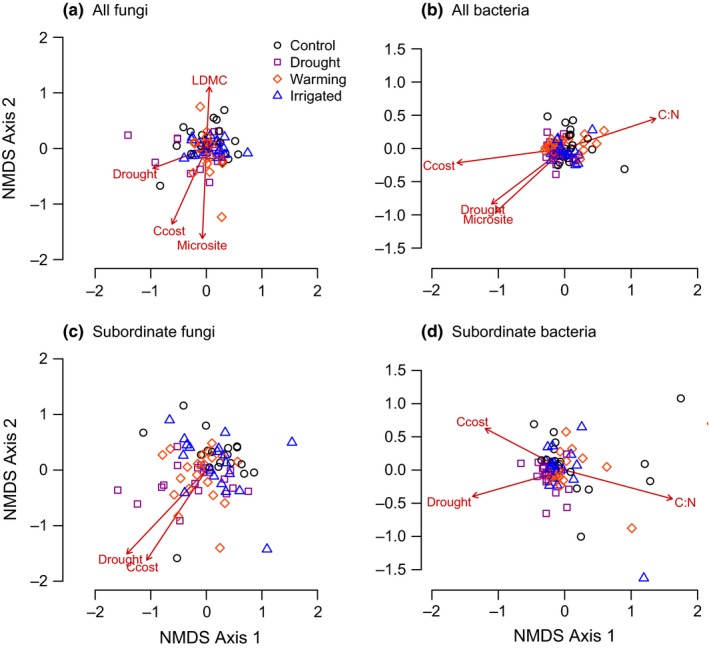
Figure 3.

NMDS representation of (a) the soil fungal community, (b) the soil bacterial community, (c) subordinate fungal taxa, and (d) subordinate bacterial taxa in microsites within the Buxton climate treatments; ordinations were based on Bray–Curtis dissimilarities and significant correlations of community‐weighted plant functional traits and environmental variables with ordination axes are shown as arrows, where “Msite” is a microsite score based on multiple measurements of soil depth and pH, “Ccost” is the construction cost of plant material, “C:N” is the carbon‐to‐nitrogen ratio of plant material, and “LDMC” is leaf dry matter content
