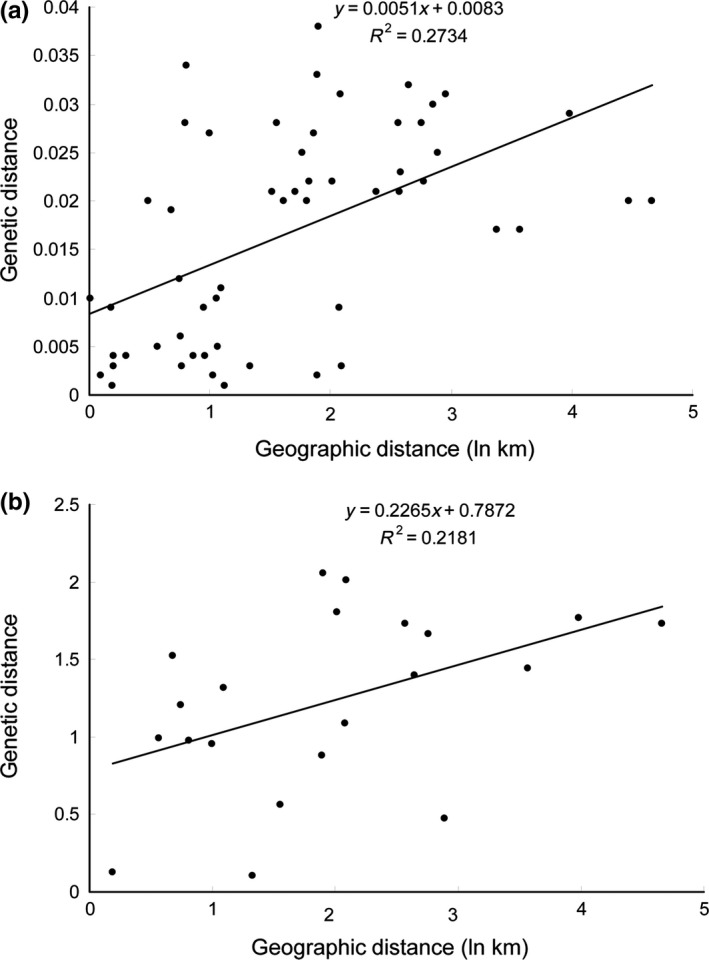
Figure 3.

Scatter plots of genetic distance vs. geographical distance (km: kilometer) for pairwise population comparisons inferred from cyt b (a) and microsatellite data (b)

Scatter plots of genetic distance vs. geographical distance (km: kilometer) for pairwise population comparisons inferred from cyt b (a) and microsatellite data (b)