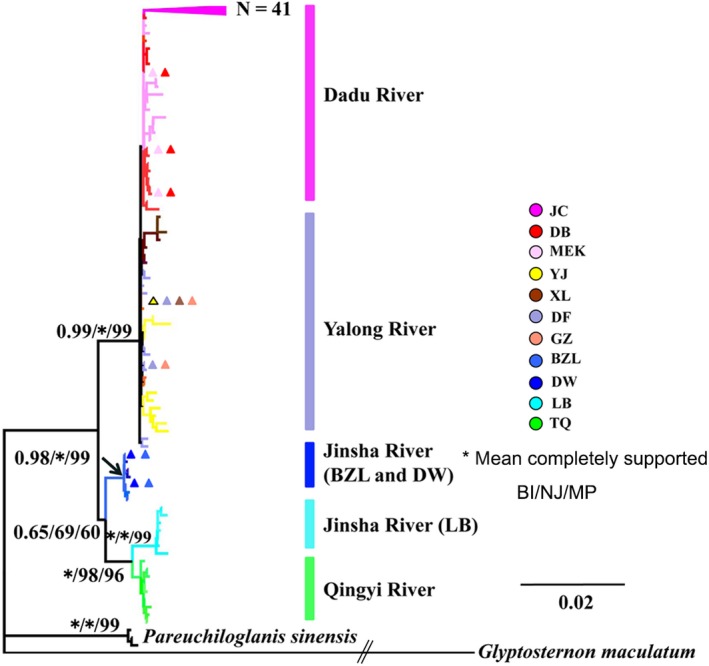
Figure 4.

Phylogenetic relationships based on cyt b haplotypes. Numbers represented nodal supports inferred from Bayesian posterior probability (BI), neighbor‐joining probability (NJ), and maximum parsimony bootstrap analyses (MP), respectively. The supported or bootstrap value was only displayed among main clades. The symbol of “*” indicated a well‐supported Bayes posteriori possibility that reached a level of 1.0 or a significant bootstrap level of 100. Glyptosternon maculatum was used as an outgroup. Different colors do indicating different geographical locations
