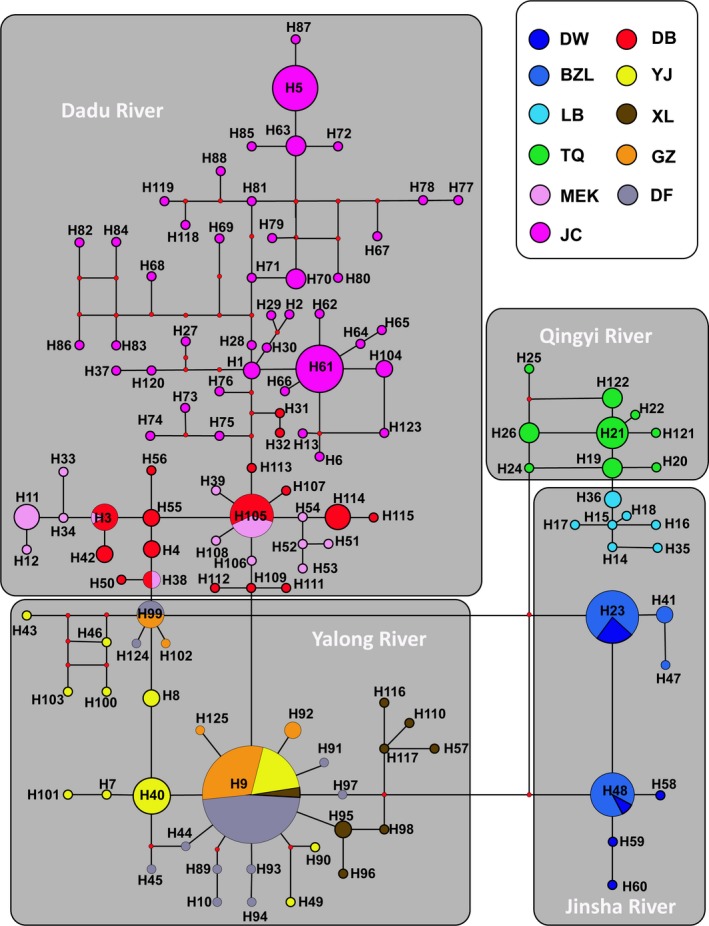
Figure 5.

Median‐joining network of haplotypes identified in the cyt b. Haplotype numbers are consistent with those showed in Table S1. Circle sizes indicated the approximate numbers of individuals. Red dots represented number of nucleotide substitutions between haplotypes. Different colors indicated different geographical locations
