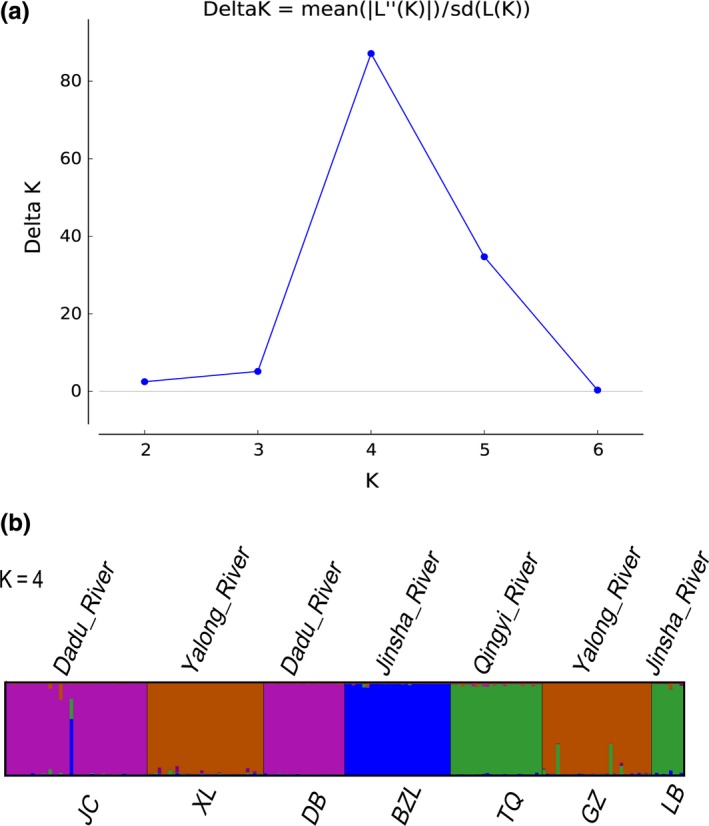
Figure 6.

Structure clustering conducted based on microsatellite loci within populations of Euchiloglanis. (a) Delta K as a function of the K values according to 20 run outputs and (b) structure results at K = 4, with different colors indicating different clusters
