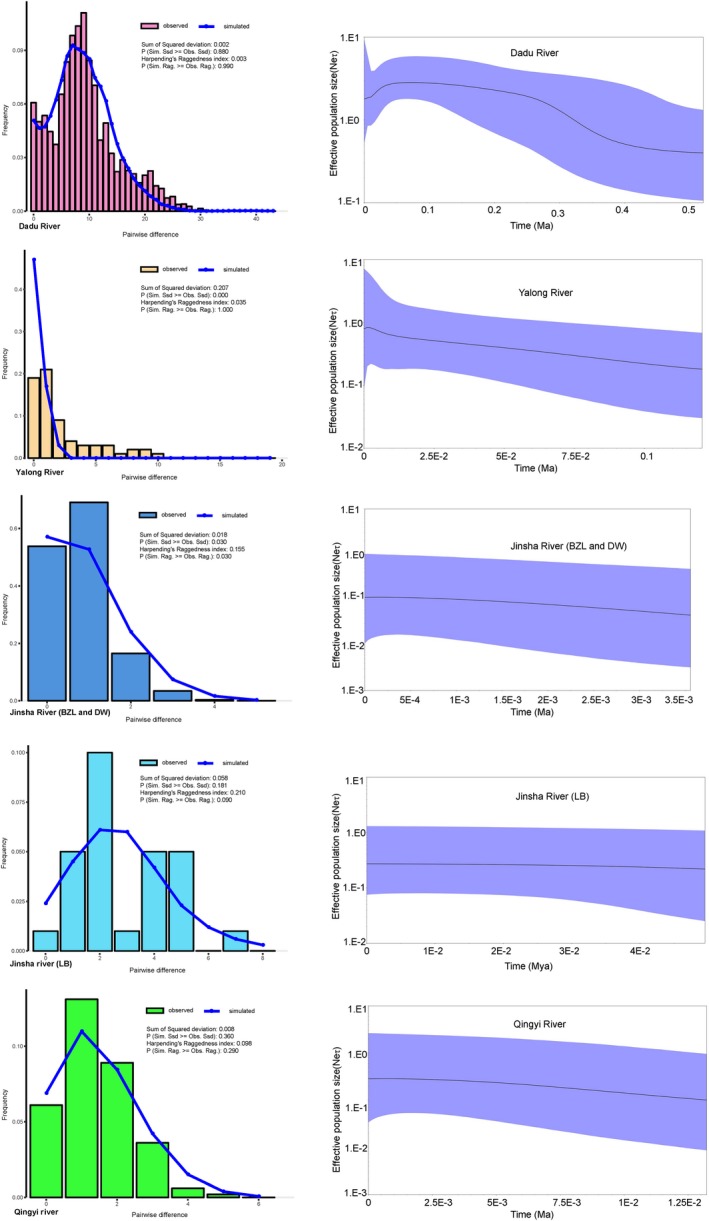
Figure 8.

Mismatch distributions (left) and Bayesian skyline plots (right) of five population groups of Euchiloglanis inferred from mtDNA cyt b sequences. The Dadu River groups were analyzed according to sampled populations of JC, DB, and MEK. The Yalong River was computed based on the sampled populations of YJ, XL, DF, and GZ. The third group was calculated based on the sampled populations of BZL and DW. The other two groups were calculated based on the population of LB and TQ, respectively. For Bayesian skyline plots, the x‐axes were the time scale in million years, and the y‐axes were effective population size (units = Ne *τ, Ne represents the effective population size, τ represents generational time of the organism), the black line depicts the median population size, and the shaded areas represented the 95% confidence intervals of HPD analysis
