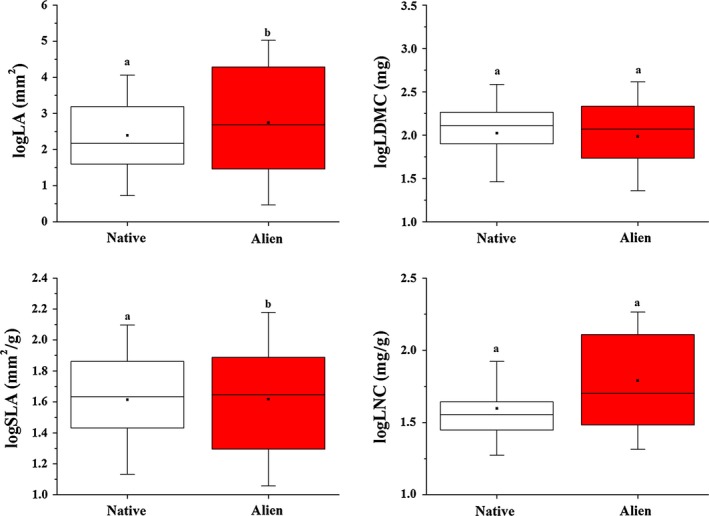
Figure 1.

Boxplot of leaf area (LA), leaf dry matter content (LDMC), specific leaf area (SLA), and leaf nitrogen content (LNC) of hydrophyte alien and native species. Values are log‐transformed. Whiskers are standard deviations. Different letters means significant differences between alien (red box) and native (open box) species obtained by linear mixed model, where traits and nativeness was incorporated with growth‐form, environmental variables, spatiality and species identity into one model
