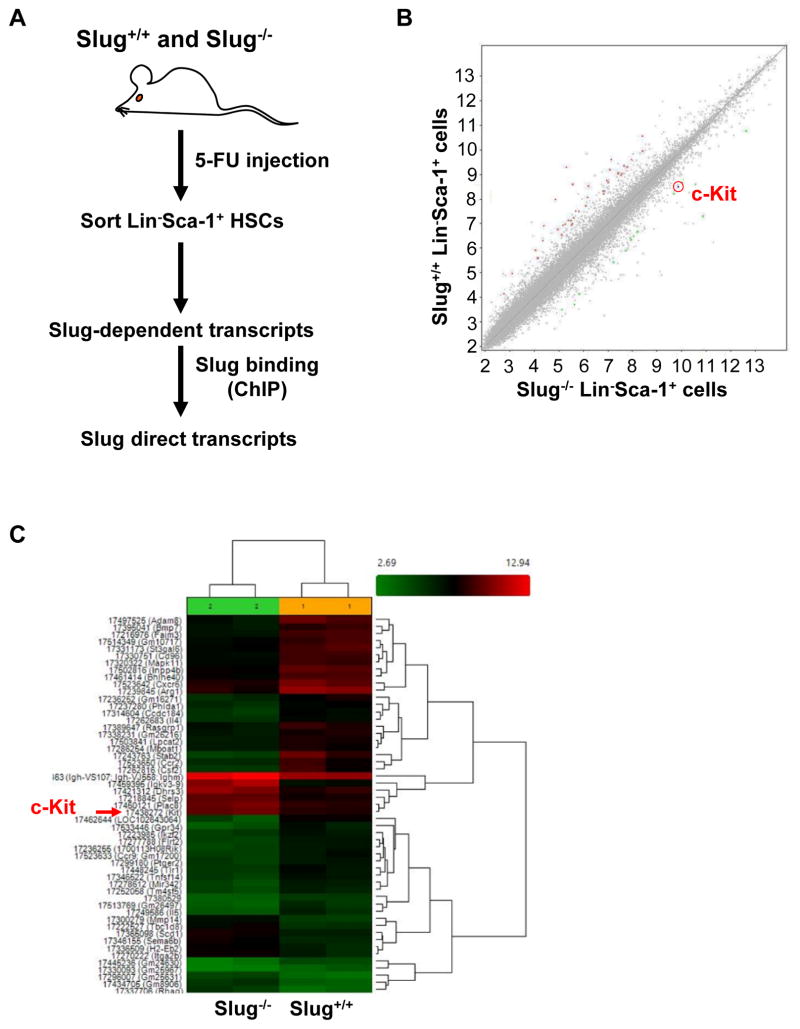
Figure 1. Gene Profiling by microarray analysis Identifies c-Kit as a Target of Slug in HSCs During Hematopoietic Regeneration.
(A) Diagram for identifying HSC-enriched Slug target genes upon BM regeneration.
(B, C) Microarray analysis of gene expression profiles in HSPCs from Slug+/+ and Slug−/− mice after 5-FU treatment (n = 2). The mice were injected 5-FU at 150 mg/kg body weight. The BM cells were isolated at day 7 after 5-FU injection. Lin−Sca-1+ HSPC subpopulation was sorted by FACs and extracted RNA for microarray analysis. The red arrow indicates c-Kit (C). Microarray data was analyzed by ANOVA test.
See also Figure S1.

