Figure 6.
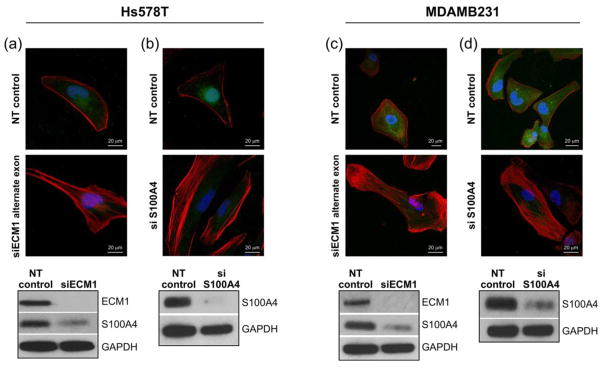
Changes in cellular cytoskeleton are ECM1 specific and may be related to altered levels of S100A4. (A and C) ECM1 was silenced in both cell lines using a different siRNA (Alternate exon) and the cells showed similar morphological changes with increased stress fiber formation. ECM1 silencing was also associated with downregulation of S100A4 levels. (B and D) Silencing S100A4 also leads to increased stress fiber formation. All immunofluorescence images are at 60× magnification. Similar to Fig. 4, Blue represents the nucleus, Red represents F-actin and Green represents G-actin.

