
Figure 2.
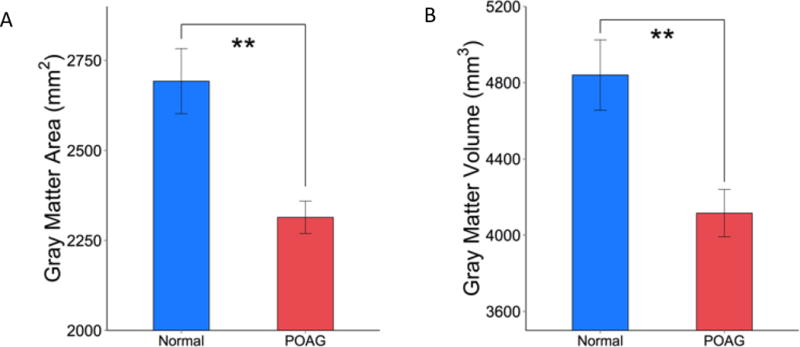
Group comparison of (A) area and (B) volume of the primary visual cortex V1 from normal controls and POAG subjects. Mean ± SEM. ** p < 0.01
Official websites use .gov
A
.gov website belongs to an official
government organization in the United States.
Secure .gov websites use HTTPS
A lock (
) or https:// means you've safely
connected to the .gov website. Share sensitive
information only on official, secure websites.
Group comparison of (A) area and (B) volume of the primary visual cortex V1 from normal controls and POAG subjects. Mean ± SEM. ** p < 0.01