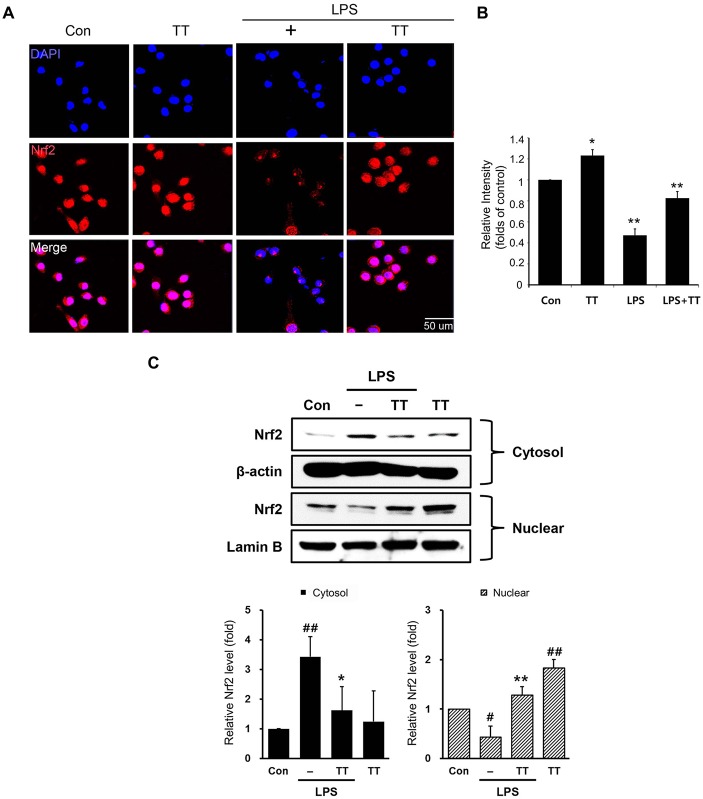
Figure 6.
Nuclear factor erythroid 2-related factor 2 (Nrf2)/heme oxygenase 1 (HO-1) signaling pathway activation in tryptanthrin pre-treated BV2 microglia. (A) Immunostaining data showing the expression of Nrf2 was greater in tryptanthrin pretreated BV2 microglia than in BV2 microglia treated with LPS alone. (B) The graph of Nrf2 immunostaining relative intensity in BV2 microglia. (C) Western blotting data showed that the translocation of Nrf2 from cytosol into nucleus using nucleus fraction. Each experiment conducted four repeats per conditions. Results are expressed as means ± SDs. Results are expressed as means ± SDs. Significant vs. control, #p < 0.05, ##p < 0.01; significant vs. LPS, *p < 0.05, **p < 0.01 (ANOVA analysis). Scale bar: 50 μm, 4′,6-diamidino-2-phenylindole (DAPI): blue, Nrf2: red. Con, non-treated control; LPS, LPS (1 μg/ml) treated cells; TT, tryptanthrin.

