
FIGURE 3.
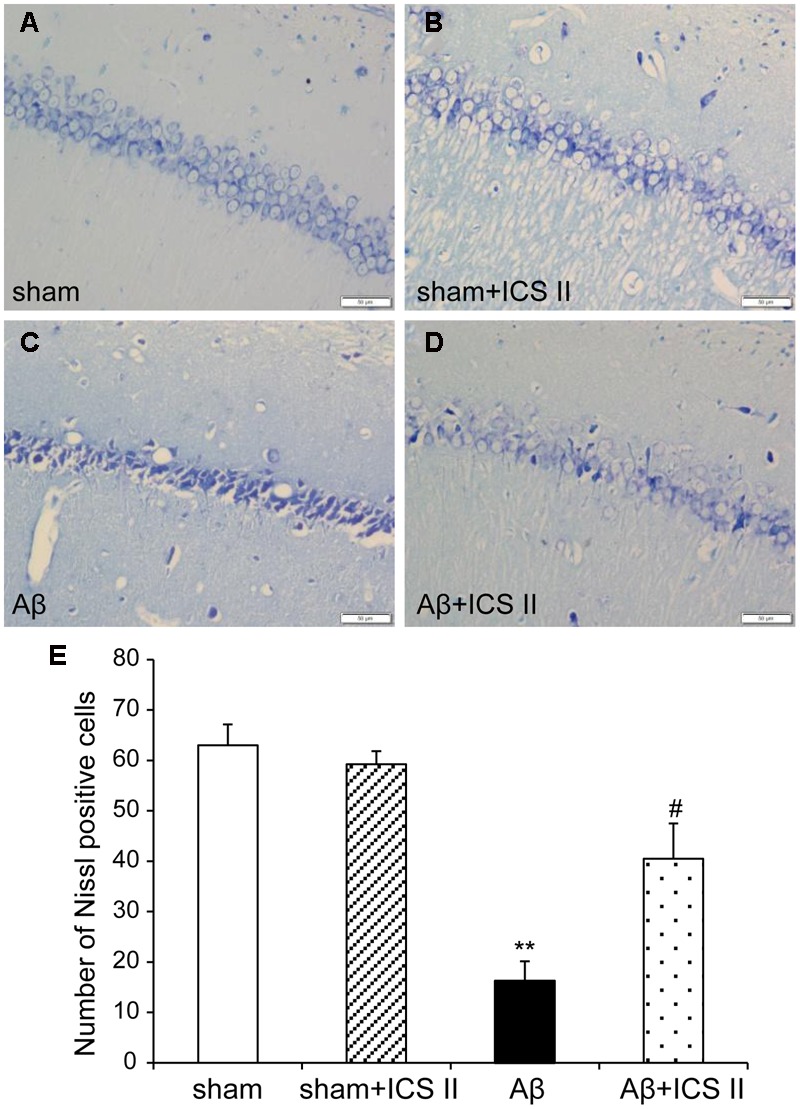
Icariside II protected against Aβ25-35-induced neuronal death in the hippocampus. (A–D) Nissl staining of hippocampus CA1 region sections (magnification 400×, scale bar 50 μm). (E) Quantitative analysis of Nissl bodies in the hippocampus CA1 region. Data were expressed as mean ± SEM, n = 4. ∗∗P < 0.01 vs. sham; #P < 0.05 vs. Aβ alone.