
FIGURE 9.
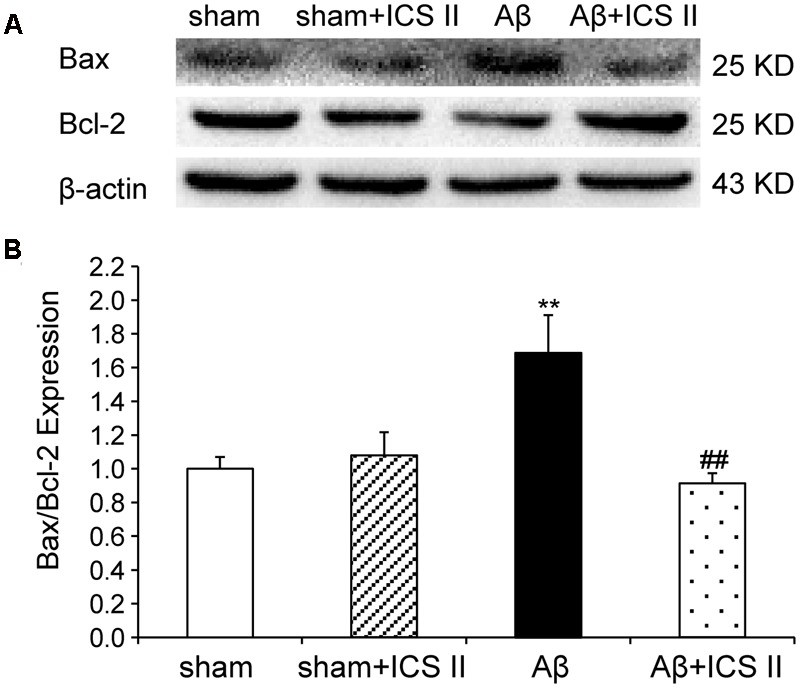
Icariside II reduced the Bax/Bcl-2 ratio in the hippocampus of Aβ25-35-induced rats. (A) Representative bands of Bax and Bcl-2 of different groups. (B) Bax/Bcl-2 ratio. The relative OD was normalized to β-actin. Data were expressed as mean ± SEM (n = 3). ∗∗P < 0.01 vs. sham; ##P < 0.01 vs Aβ alone.