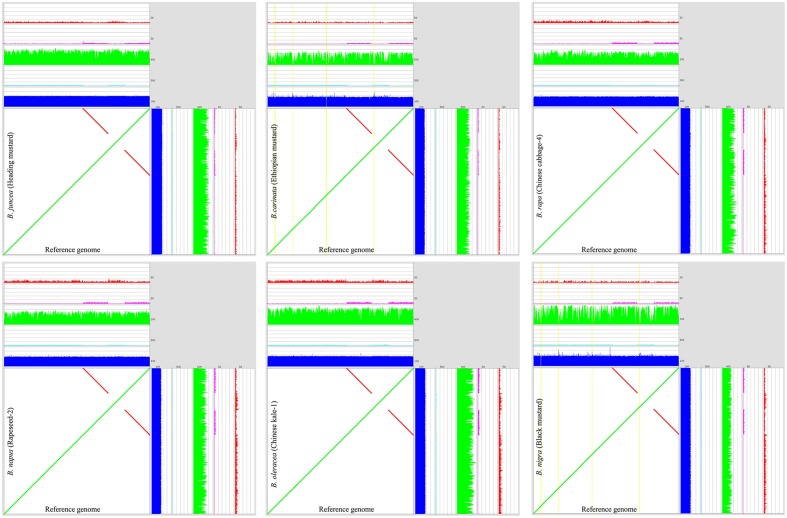
FIGURE 1.
Comparison of the de novo assembled chloroplast genomes (along the Y-axis) with the reference chloroplast genome of B. rapa Chiifu (along the X-axis) visualized in a mummer-plot. In the MUMmer-plots, yellow lines denote areas with paired-end coverage of less than 10% of the average. The colored tracks shown in each figure are the average fragment length of the paired-end data (blue), relative number of non-mapped base pairs (cyan), paired-end sequenced DNA fragments coverage (green), nucleotide coverage by discordant read-pairs (pink) and nucleotide coverage by linking read-pairs (red), respectively.

