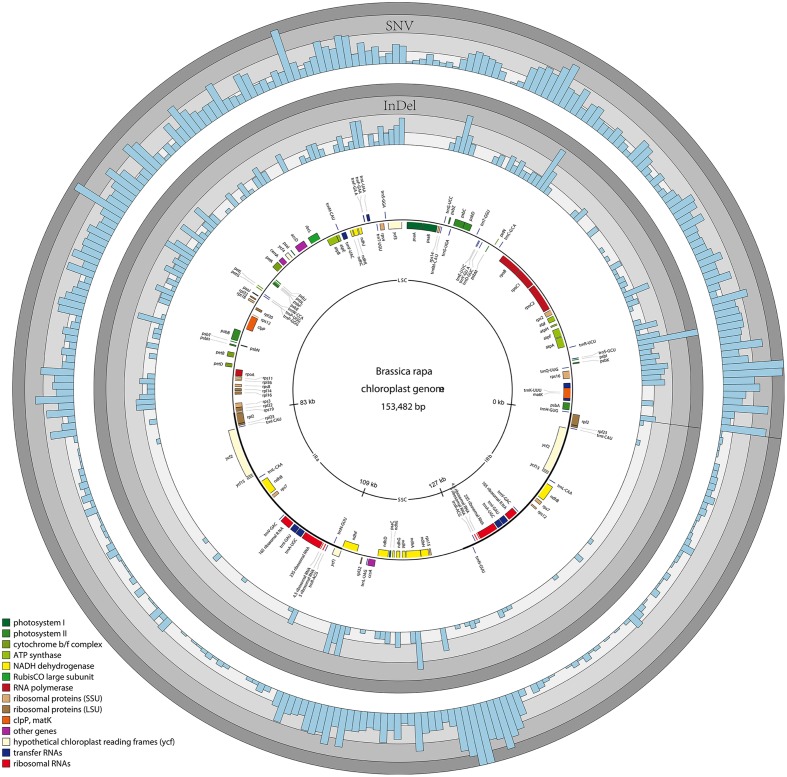
FIGURE 2.
Variability of the six economically important Brassica species represented over the circular map of the B. rapa chloroplast genome. The two inverted repeat regions (IRa and IRb) separate the large (LSC) and small (SSC) single copy regions, respectively. The colored rings represent the density of single nucleotide variants (SNVs) (0–35) and InDels (0–16).

