Figure 6.
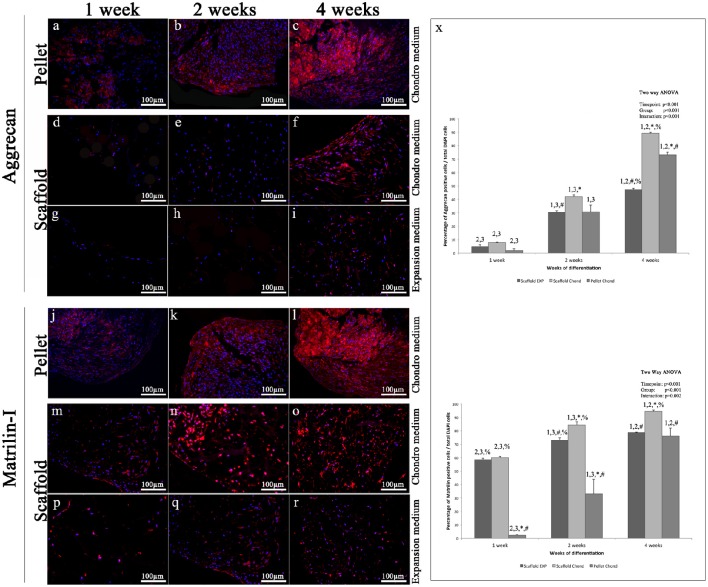
Immunofluorescent analysis of representative chondrogenic markers: (A–I) Aggrecan, (J–R) Matrilin, performed on hADSCs and hADSCs cultured on scaffolds either in expansion (G–I,P–R) or in chondrogenic (A–F,J–O) medium, at different time points (1, 2, and 4 weeks), magnification 20x. (X) Average cellular positivity for chondrogenic markers in both expansion (dark bars) and chondrogenic medium (dark and medium bars). Percentage of Aggrecan and Matrilin (X) are calculated on the total number of DAPI stained cells in the investigated fields. Two-way ANOVA p values are reported. Symbols above bars indicate statistically significant differences (p < 0.05) in the Tukey HSD post-hoc tests: 1 indicates differences with the 1 week group (same medium), 2 indicates differences with the 2 weeks group (same medium), 3 indicates differences with the 4 weeks group (same medium), 4 indicates differences with the 8 weeks group (same medium), * indicates differences with scaffold expansion medium group (same time-points), # indicates differences with scaffold chondrogenic medium group (same timepoints) and % indicates differences with pellet group (same timepoints). Average cellular positivity for chondrogenic markers at 2 (dark bars) and 4 weeks (light bars). Three independently isolated hADSC samples have been used for each time-point.

