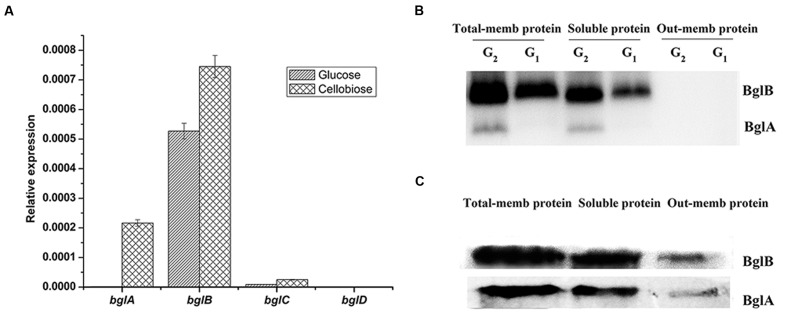
FIGURE 1.
Expression and distribution pattern of the β-glucosidases. (A) Quantitative RT-PCR analysis of the expression of β-glucosidases in the wild type strain of C. hutchinsonii in glucose culture and cellulose. Expression levels of 16srRNA were used as an endogenous control in all samples and expression levels of 16srRNA were normalized to 1. Values are the mean of three biological replicates. Error bars are the standard deviations from these replicates. (B) β-Glucosidases renatured SDS-PAGE assay of total membrane protein (total-mem protein), soluble protein and outer membrane protein (outer-mem protein). Proteins were extracted from glucose culture (G1) and cellobiose culture (G2). (C) Western blot analysis of BglA and BglB in different protein components. Proteins were extracted from wild type cells induced by 0.4% (wt/vol) cellobiose for 4 h.

